Dear stockbrokers, dear stockbrokers,
In 2022 we fell quite hard at times. Once you didn’t research properly, once you overlooked a piece of information, one or the other share was already in the basement. The development is clear: the wheat is being separated from the chaff. The market is increasingly becoming an event for professionals again.
More and more retail and lay investors are giving up because they don’t have the right tools for the current market. That’s a shame, and it doesn’t have to be. That’s why I got a small compendium of key figures from my US colleague, shortened it slightly and finally had it translated for you.
This mini dictionary of key figures is currently a real hit among US investors. The scales fall from the eyes of many private investors. They suddenly understand why their ideas often didn’t work in the end. But most importantly, US investors understand how they can do much better in the year ahead with the right analytical tool at hand.
Apart from that, it only remains for me to wish you a Happy New Year. I admit that I’ll be glad when this difficult year on the stock market is over. The new can only get better. I am firmly convinced of that.
Equities: These key figures are really meaningful and bring returns
Dear stockbrokers, dear stockbrokers,
my two year old daughter loves to ride her scooter, especially downhill. She likes the thrill. This embarrasses mom (and sometimes dad too). But she’s beginning to understand the momentum – how she picks up speed when she’s going down a dip in the pavement.
Momentum is also an important consideration when picking stocks
Market momentum is a metric tracked by financial experts, economists, and Wall Street traders. Certain stocks are showing signs that they are positioned for growth (and profits accordingly) in the near term. As analysts, we follow these harbingers and invest accordingly.
These indicators can be so-called fundamental financial metrics such as earnings per share or price-to-earnings ratios that help assess the overall picture of the company. Then there are technical indicators, such as the stock’s actual price performance.
But even if you look at a company’s historical earnings data, you can compare what the company has earned over the past several years and what it’s currently earning. Are yields increasing gradually or exponentially?
When you combine fundamentals with technicals, the result is market momentum. And I want to know as much as I can about these metrics before I invest. First, let me explain a few key elements of stock analysis to you. Then I’ll show you key indicators of a stock’s market momentum.
Basic elements of stock analysis
You can complete a full master’s degree and still not learn much about stock market analysis. Here are the basic terms you should know:
Fundamental Analysis:
Stocks represent companies that have enough wealth and growth to be traded on the stock exchange. Fundamental analysis is all about a company’s financials: its balance sheets, income statements, cash flow statements, cost statements, assets, market share, and other metrics.
All of this can help us assess a company’s financial health and ultimately approximate its stock value.
Earnings per share:
Earnings per share (EPS) is a financial indicator. It determines the value of a share. Earnings per share are calculated by dividing the company’s net income by the shares outstanding (outstanding). The higher this value, the higher the value of the stock.
However, you shouldn’t use this metric alone to evaluate a stock, as it can be intentionally or unintentionally biased.
For example, a one-off supply shortage may have prevented a company from achieving its usual sales quota, resulting in lower EPS for the quarter. Or, a company could deliberately manipulate its stock price through stock offerings, stock splits, and/or stock buybacks, thereby altering how EPS is calculated.
Price to Earnings Ratio (P/E):
The price-earnings ratio (P/E) is like a fresh cup of coffee: you don’t want it too hot (too high), but you don’t want it chilled (too low) either. A company’s P/E ratio is calculated by dividing its stock price by its earnings per share. So it is another method of calculating stock value.
A high P/E ratio might indicate that a stock is overvalued, while a low P/E ratio might indicate the opposite. But a company that doesn’t make money obviously doesn’t have a P/E either.
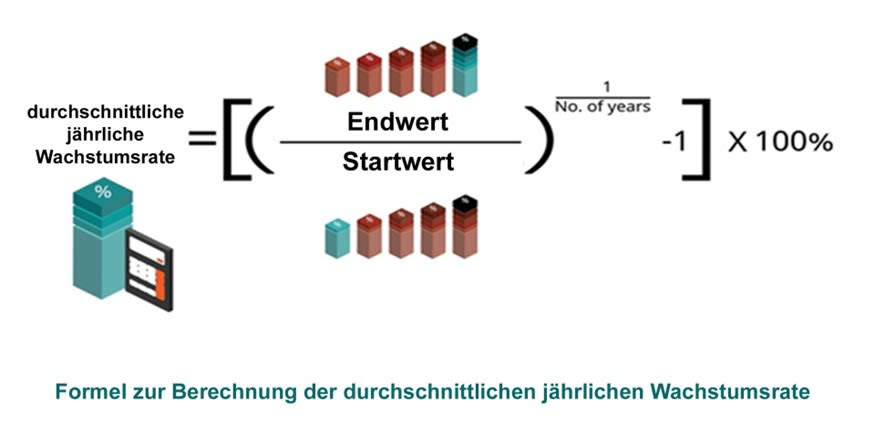
Average annual growth rate:
Compounded annual growth rate (CAGR) measures the return on a company’s investments over a period of time.
The CAGR indicates how much an investment must grow from its opening balance to its ending balance.
Price Earnings Growth
Price to earnings to growth
This indicator provides information about whether a stock is correctly valued. Using it along with earnings per share and price to earnings gives a much clearer picture of a stock’s value.
Technical analysis:
This goes beyond key figures. Technical stock analysis is both macro and microeconomic. It shows the big picture of market activity and measures the performance of individual stocks within their sector.
Stock analysts become historians. They go back and look at years (and even decades) of market data. They deal with the supply and demand of a particular market. Then they become forecasters, using graphs and charts from that data to predict how a stock might perform in the future. But instead of a five-day forecast, these forecasts can range days, months, or years into the future.
In my experience, the best stocks can be identified by five key signs that they are poised for growth. Today I’m going to give you three of those signs. You can find out more about this here.
3 signs a stock has market momentum
An expanding and totally addressable market
A company must have its own niche within its industry in order to survive and thrive. Total addressable market (TAM) considers the available market for a given product or service. It provides insight into how much potential revenue a company could generate.
But in addition to the TAM, there are two other related terms:
– the serviceable market (SAM) and
– the serviceable obtainable market (SOM).
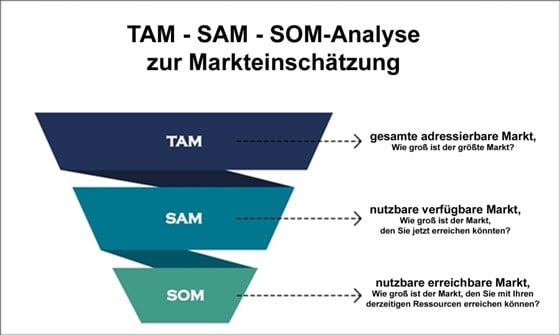
All of these metrics work together to determine how a company is positioned in its market and whether it is poised for growth.
One of the markets that I follow closely is the technology sector (and its many sub-sectors). I look for companies that are constantly innovating, especially ones that will be much larger in five to ten years. But I also look for companies that use breakthrough technology to give themselves an „unfair“ advantage over their competitors. This makes them more valuable as an investment opportunity.
Projected sales growth
There’s a specific percentage of annual sales growth that I look for in stocks to find stocks that are already showing annual growth. The sales growth is determined from two equal periods (e.g. months). To do this, the first month’s sales are subtracted from the second month’s sales. Then the result is divided by the first month’s sales and finally multiplied by 100 to convert it to a percentage.
Surpassing Wall Street estimates
When a company starts beating Wall Street’s earnings estimates, it means analysts are missing something big. When management revises their estimates higher, it signals that the company’s growth momentum is picking up.
I typically use two other metrics to identify stocks with what I call „true momentum.“ But I don’t want to reveal everything at this point… You can read more about this in the premium package from the Investor Publishers, which I am happy to support with its own publication.
How to invest in the right growth stocks
Navigating the stock market isn’t easy, even for seasoned professionals. The current bear market is particularly difficult. But that’s exactly why I’m here – to help you find your way around. I have a team of analysts to help me research the tech markets using all the tools and metrics I’ve outlined in this article.
Benefit from my comprehensive technical and fundamental analysis in the New Year! You can find out more about me and my team here.
With kind regards
Her

IanKing
Analyst and Investment Advisor
PS Next week, by the way, my colleague Jim Rickards will have his say here. He predicted the current market problems like hardly any other analyst. What is he saying now? I think you need to know. So be on board with us again in the New Year (January 2nd)!